Dryden Gold Corp. (DRY:TSX; DRYGT:OTC) is a most interesting advanced stage gold exploration company with an extensive land package in mining friendly Ontario where infrastructure is excellent and the fact that industry legends Eric Sprott and Rob McEwen have significant shareholdings in the company speaks for itself.
Before examining the company's stock chart to see why its shares are so attractive at this time when the gold price is powering up for a massive advance, we will start by gaining a fundamental overview of the company by means of a selection of slides lifted from the latest investor deck.
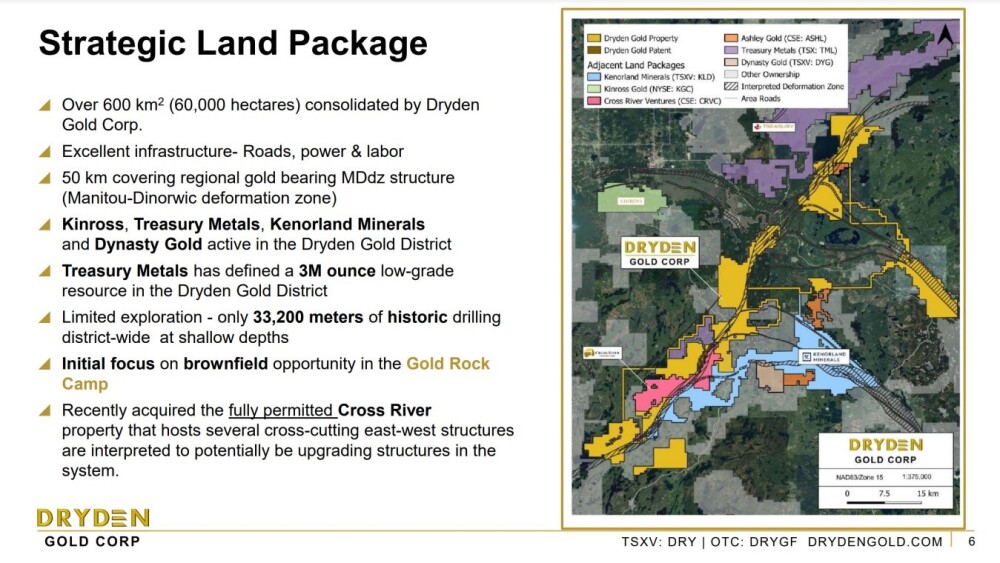
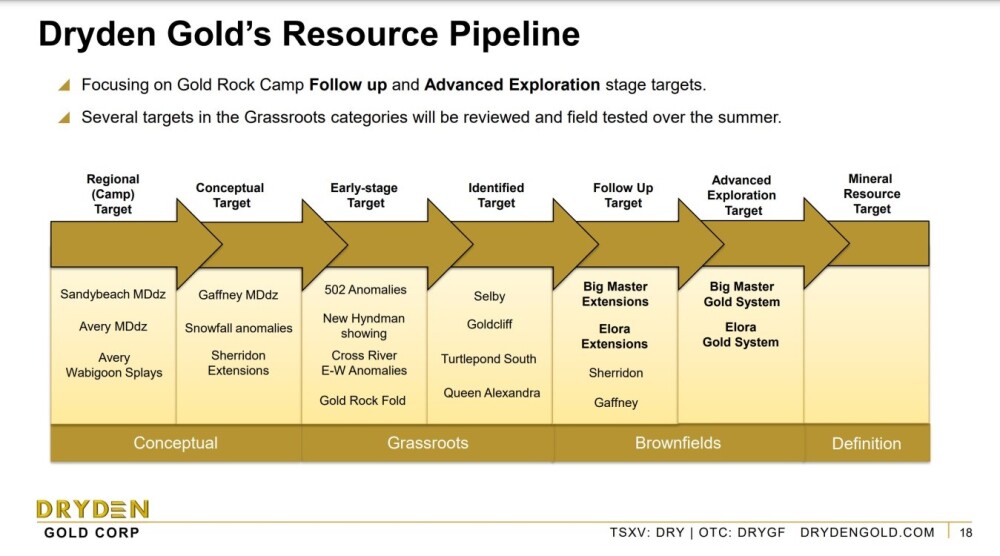
Dryden's land package comprises numerous distinct targets, from conceptual to brownfields.
The following slide includes a map showing the extent of Dryden's land package shown in an appropriate gold color and we can also see that there are a number of other important names in the industry operating nearby, such as Kenorland Minerals Ltd. (KLD:TSX.V; 3WQO:FSE), Kinross Gold Corp. (K:TSX; KGC:NYSE), and Treasury Metals Inc. (TML:TSX: TSRMF:OTCQB) and clearly they would not be there without good reason.
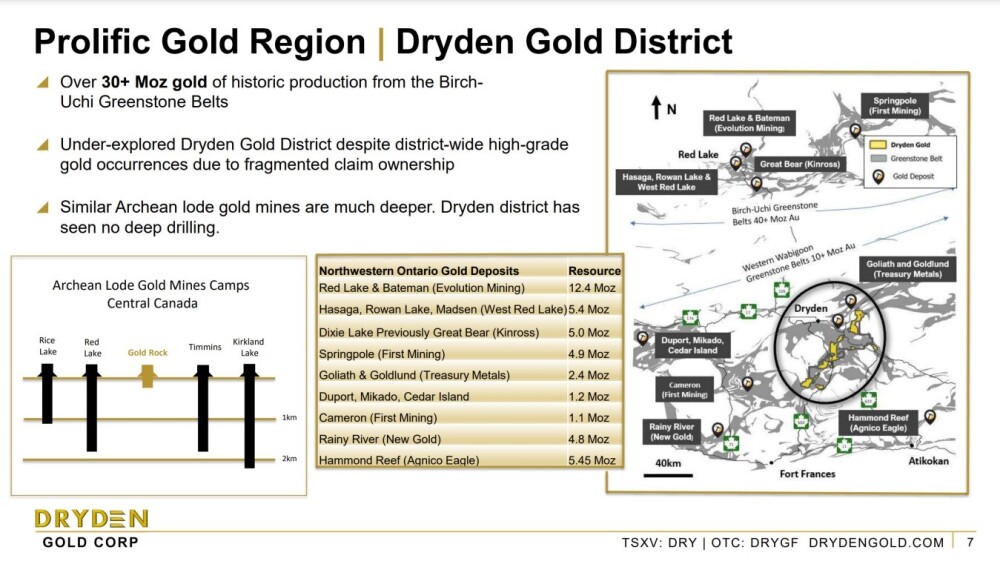
Dryden's gold properties are located in a prolific gold region as this slide makes clear, with big discoveries having been made in the past.
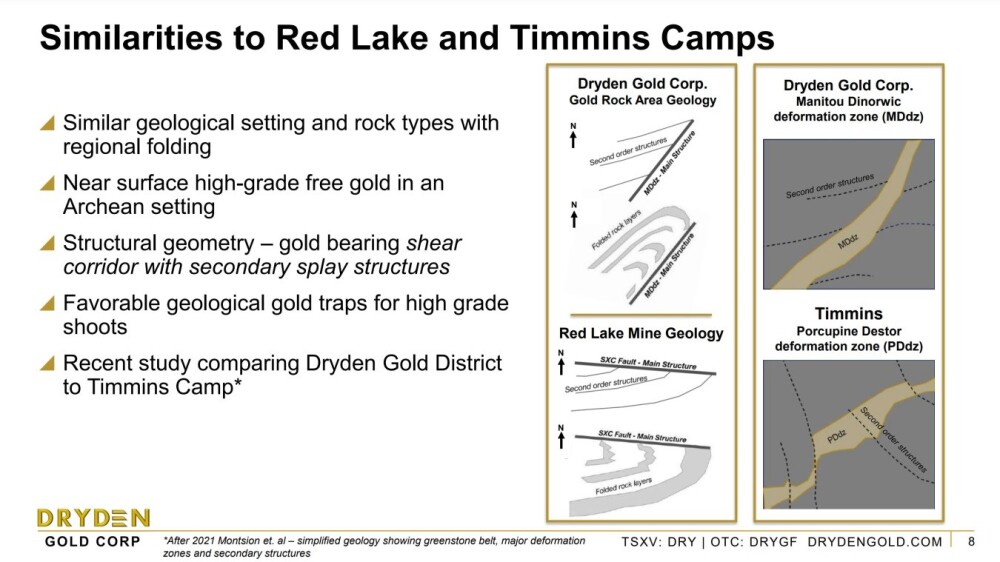
And it is most encouraging to consider that Dryden's properties have many similarities with the bounteous Red Lake and Timmins camp.
Within Dryden's properties, there are three principal projects with potential for high-grade gold discovery.
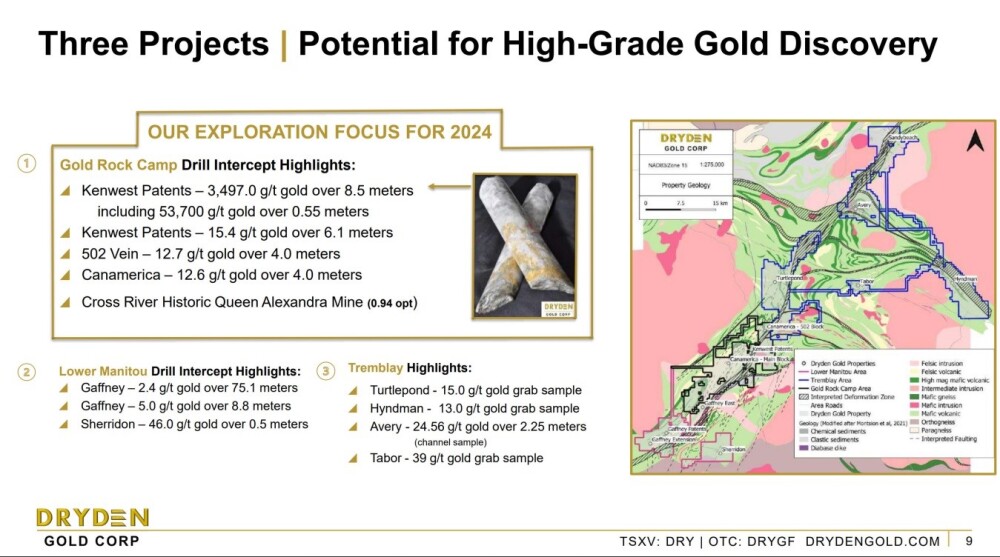
The following interesting chart shows that Dryden is moving its various projects within the district along nicely.
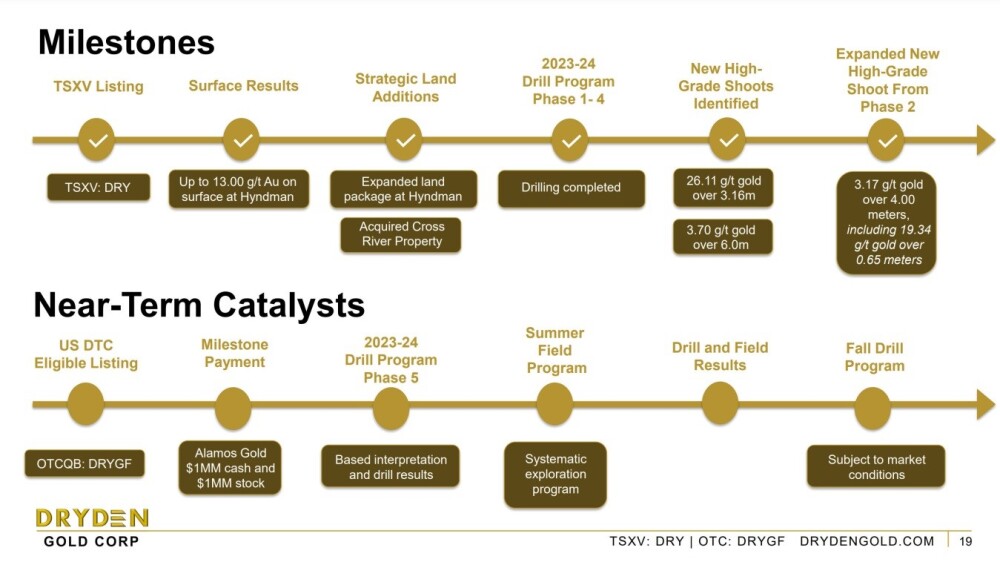
The next slide shows milestones already accomplished and near-term catalysts.
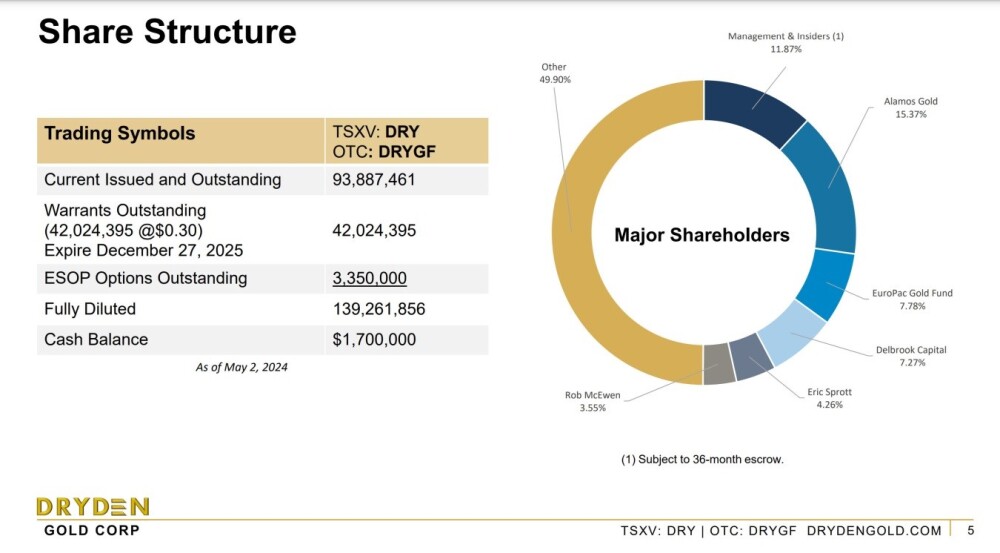
Lastly, we look at a page showing the share structure.
The pie chart illustrates that there is a lot of confidence in the company, since Alamos Gold Inc. (AGI:TSX; AGI:NYSE) has an almost 15.4% stake in it, with Eric Sprott owning 4.26%, Rob McEwen 3.55% and other important stakeholders too including management and insiders with 11.87%, leaving less than half the 93.8 million shares available to retail investors.
Turning now to an examination of the company's stock chart, a 5-month chart shows us all we need to see since the stock only started to trade on this market in January. The day it started trading, it closed with a large bearish "gravestone doji" candle on the chart, which is where there is a wide daily range, but the price opens and closes at the low of the day.
This is bearish, especially when it occurs on high volume, as was the case here. Sure enough, it went into an intermediate bear market, as very often happens with new issues because of excessive optimism at the outset, and this bear market is believed to have ended when it hit bottom in March.
After this low, it had a significant rally in April before dropping back again to the support at the March low, with which it looks like it is making a Double Bottom. The strong volume on the rally out of the March low means that the pattern that formed during late February and March can also be classified as a Cup, which is bullish and the volume dieback as the price reacted back from mid-April is also bullish and the positive volume pattern throughout explains the quite strong positive divergence of the Accumulation line.
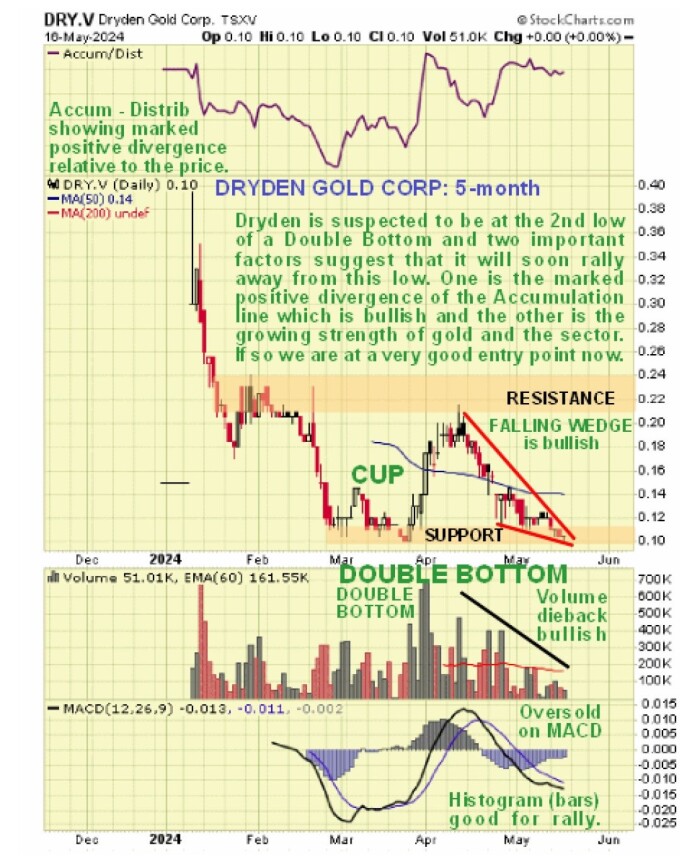
There are two important technical factors in play here that strongly suggest that Dryden Gold is about to rally out of the second low of the Double Bottom into a major bull market and those are the strongly bullish volume pattern with related positive divergence of the Accumulation line mentioned above and the increasing strength of gold itself which is believed to be on the verge of entering a period of parabolic acceleration to the upside, which will clearly be hugely beneficial to companies like Dryden.
All this being so, the interpretation is that investors are being presented here with a "last chance" to buy Dryden Gold at an excellent price before it starts higher into a major bull market and it is accordingly rated an Immediate Strong Buy.
Dryden Gold's website.
Dryden Gold Corp. (DRY:TSX; DRYGT:OTC) closed at CA$0.105, US$0.075 on May 17, 2024.
Want to be the first to know about interesting Gold investment ideas? Sign up to receive the FREE Streetwise Reports' newsletter.
Subscribe
Important Disclosures:
- For this article, the Company has paid Street Smart, an affiliate of Streetwise Reports, US$1,500.
- As of the date of this article, officers and/or employees of Streetwise Reports LLC (including members of their household) own securities of Dryden Gold Corp. and Treasury Metals Inc.
- Author Certification and Compensation: [Clive Maund of clivemaund.com] was retained and compensated as an independent contractor by Street Smart to write this article. Mr. Maund is a technical analyst who analyzes historical trading data and he received his UK Technical Analysts’ Diploma in 1989. The recommendations and opinions expressed in this content reflect the personal, independent, and objective views of the author regarding any and all of the companies discussed. No part of the compensation received by the author was, is, or will be directly or indirectly tied to the specific recommendations or views expressed.
- Statements and opinions expressed are the opinions of the author and not of Streetwise Reports, Street Smart, or their officers. The author is wholly responsible for the accuracy of the statements. Streetwise Reports requires contributing authors to disclose any shareholdings in, or economic relationships with, companies that they write about. Any disclosures from the author can be found below. Streetwise Reports relies upon the authors to accurately provide this information and Streetwise Reports has no means of verifying its accuracy.
- This article does not constitute investment advice and is not a solicitation for any investment. Streetwise Reports does not render general or specific investment advice and the information on Streetwise Reports should not be considered a recommendation to buy or sell any security. Each reader is encouraged to consult with his or her personal financial adviser and perform their own comprehensive investment research. By opening this page, each reader accepts and agrees to Streetwise Reports' terms of use and full legal disclaimer. Streetwise Reports does not endorse or recommend the business, products, services or securities of any company.
For additional disclosures, please click here.
Clivemaund.com Disclosures
The above represents the opinion and analysis of Mr. Maund, based on data available to him, at the time of writing. Mr. Maund's opinions are his own, and are not a recommendation or an offer to buy or sell securities. As trading and investing in any financial markets may involve serious risk of loss, Mr. Maund recommends that you consult with a qualified investment advisor, one licensed by appropriate regulatory agencies in your legal jurisdiction, and do your own due diligence and research when making any kind of a transaction with financial ramifications. Although a qualified and experienced stock market analyst, Clive Maund is not a Registered Securities Advisor. Therefore Mr. Maund's opinions on the market and stocks cannot be construed as a recommendation or solicitation to buy and sell securities.


